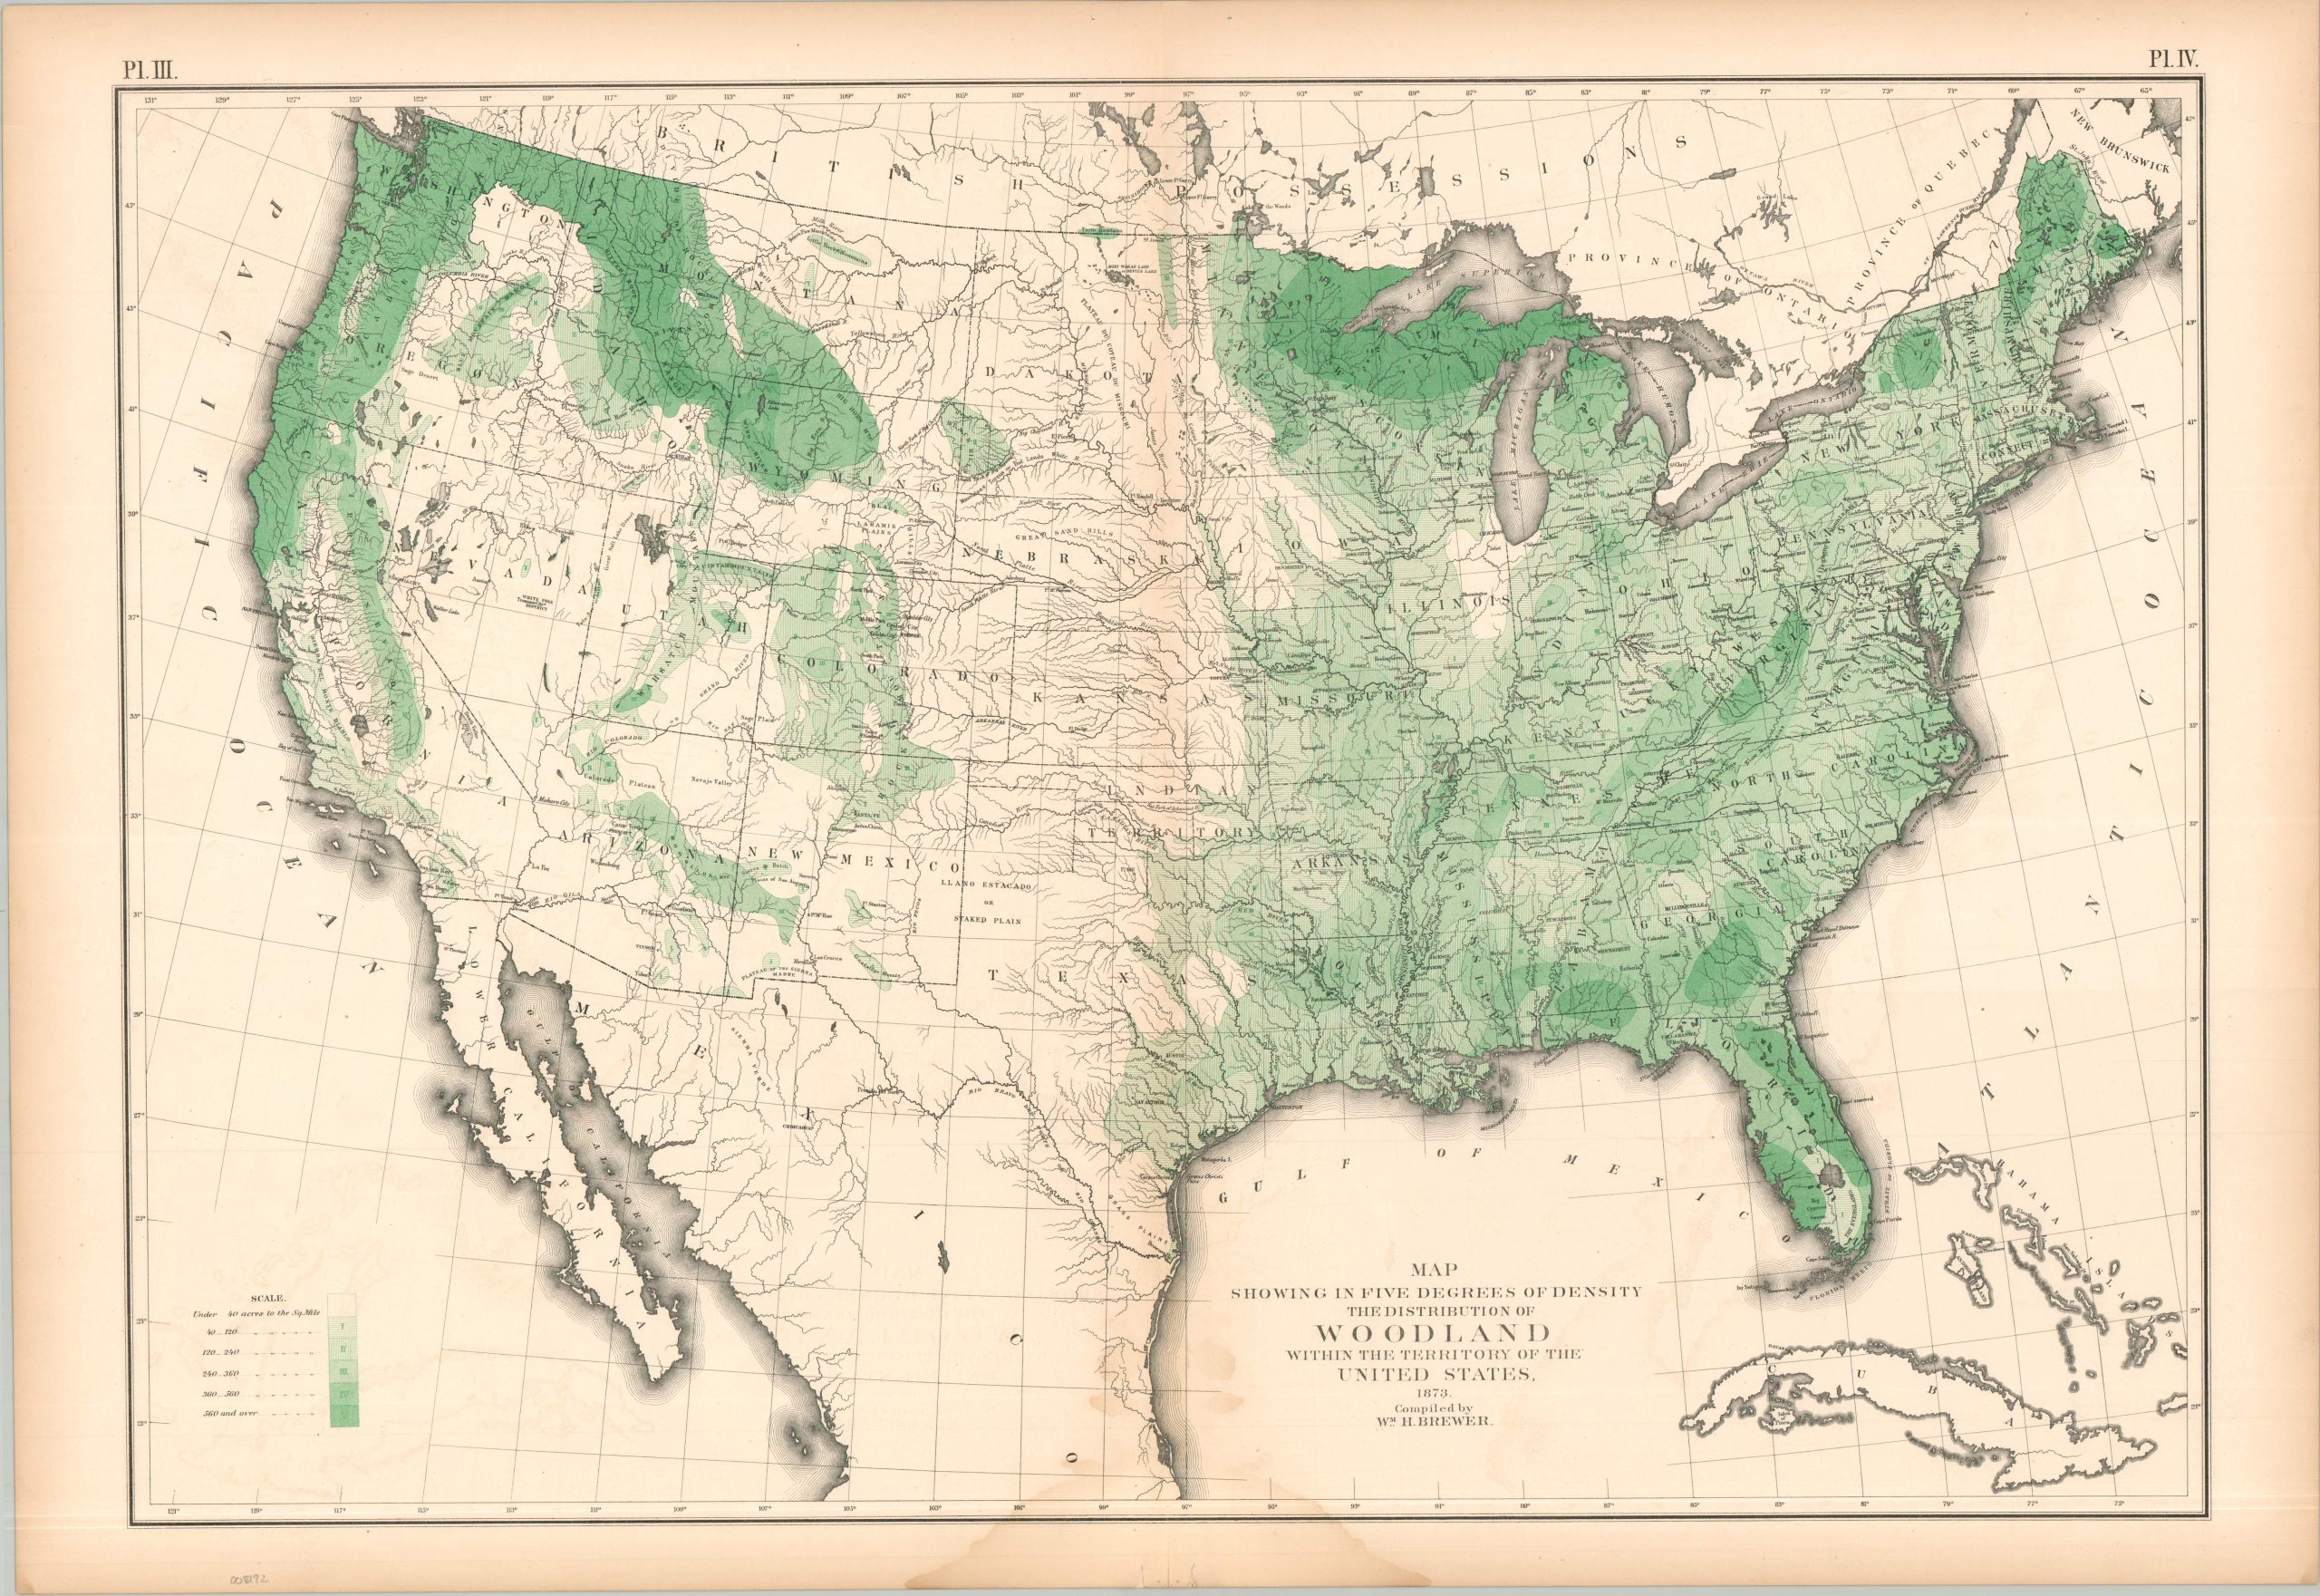
This verdant map of the United States, compiled by William Brewer, shows the density of woodland areas across the continental United States as of 1873. Five shades of green (plus white) show the variation in concentration from less than 40 acres of trees per square mile to 560 acres and over. Huge concentrations of timber are evident across the Upper Midwest and in the Pacific Northwest, reflecting massive economic potential. The map was originally issued as part of The Statistical Atlas of the United States Based on the Results of the Ninth Census, 1870, compiled by Census Superintendent Francis A. Walker. Lithographed by Julius Bien and published in 1874. The atlas serves as the ultimate 19th-century “data portrait” of a reunified nation, meticulously synthesizing geography, climate, and demographics into a visual manifesto of America’s industrial and economic potential.