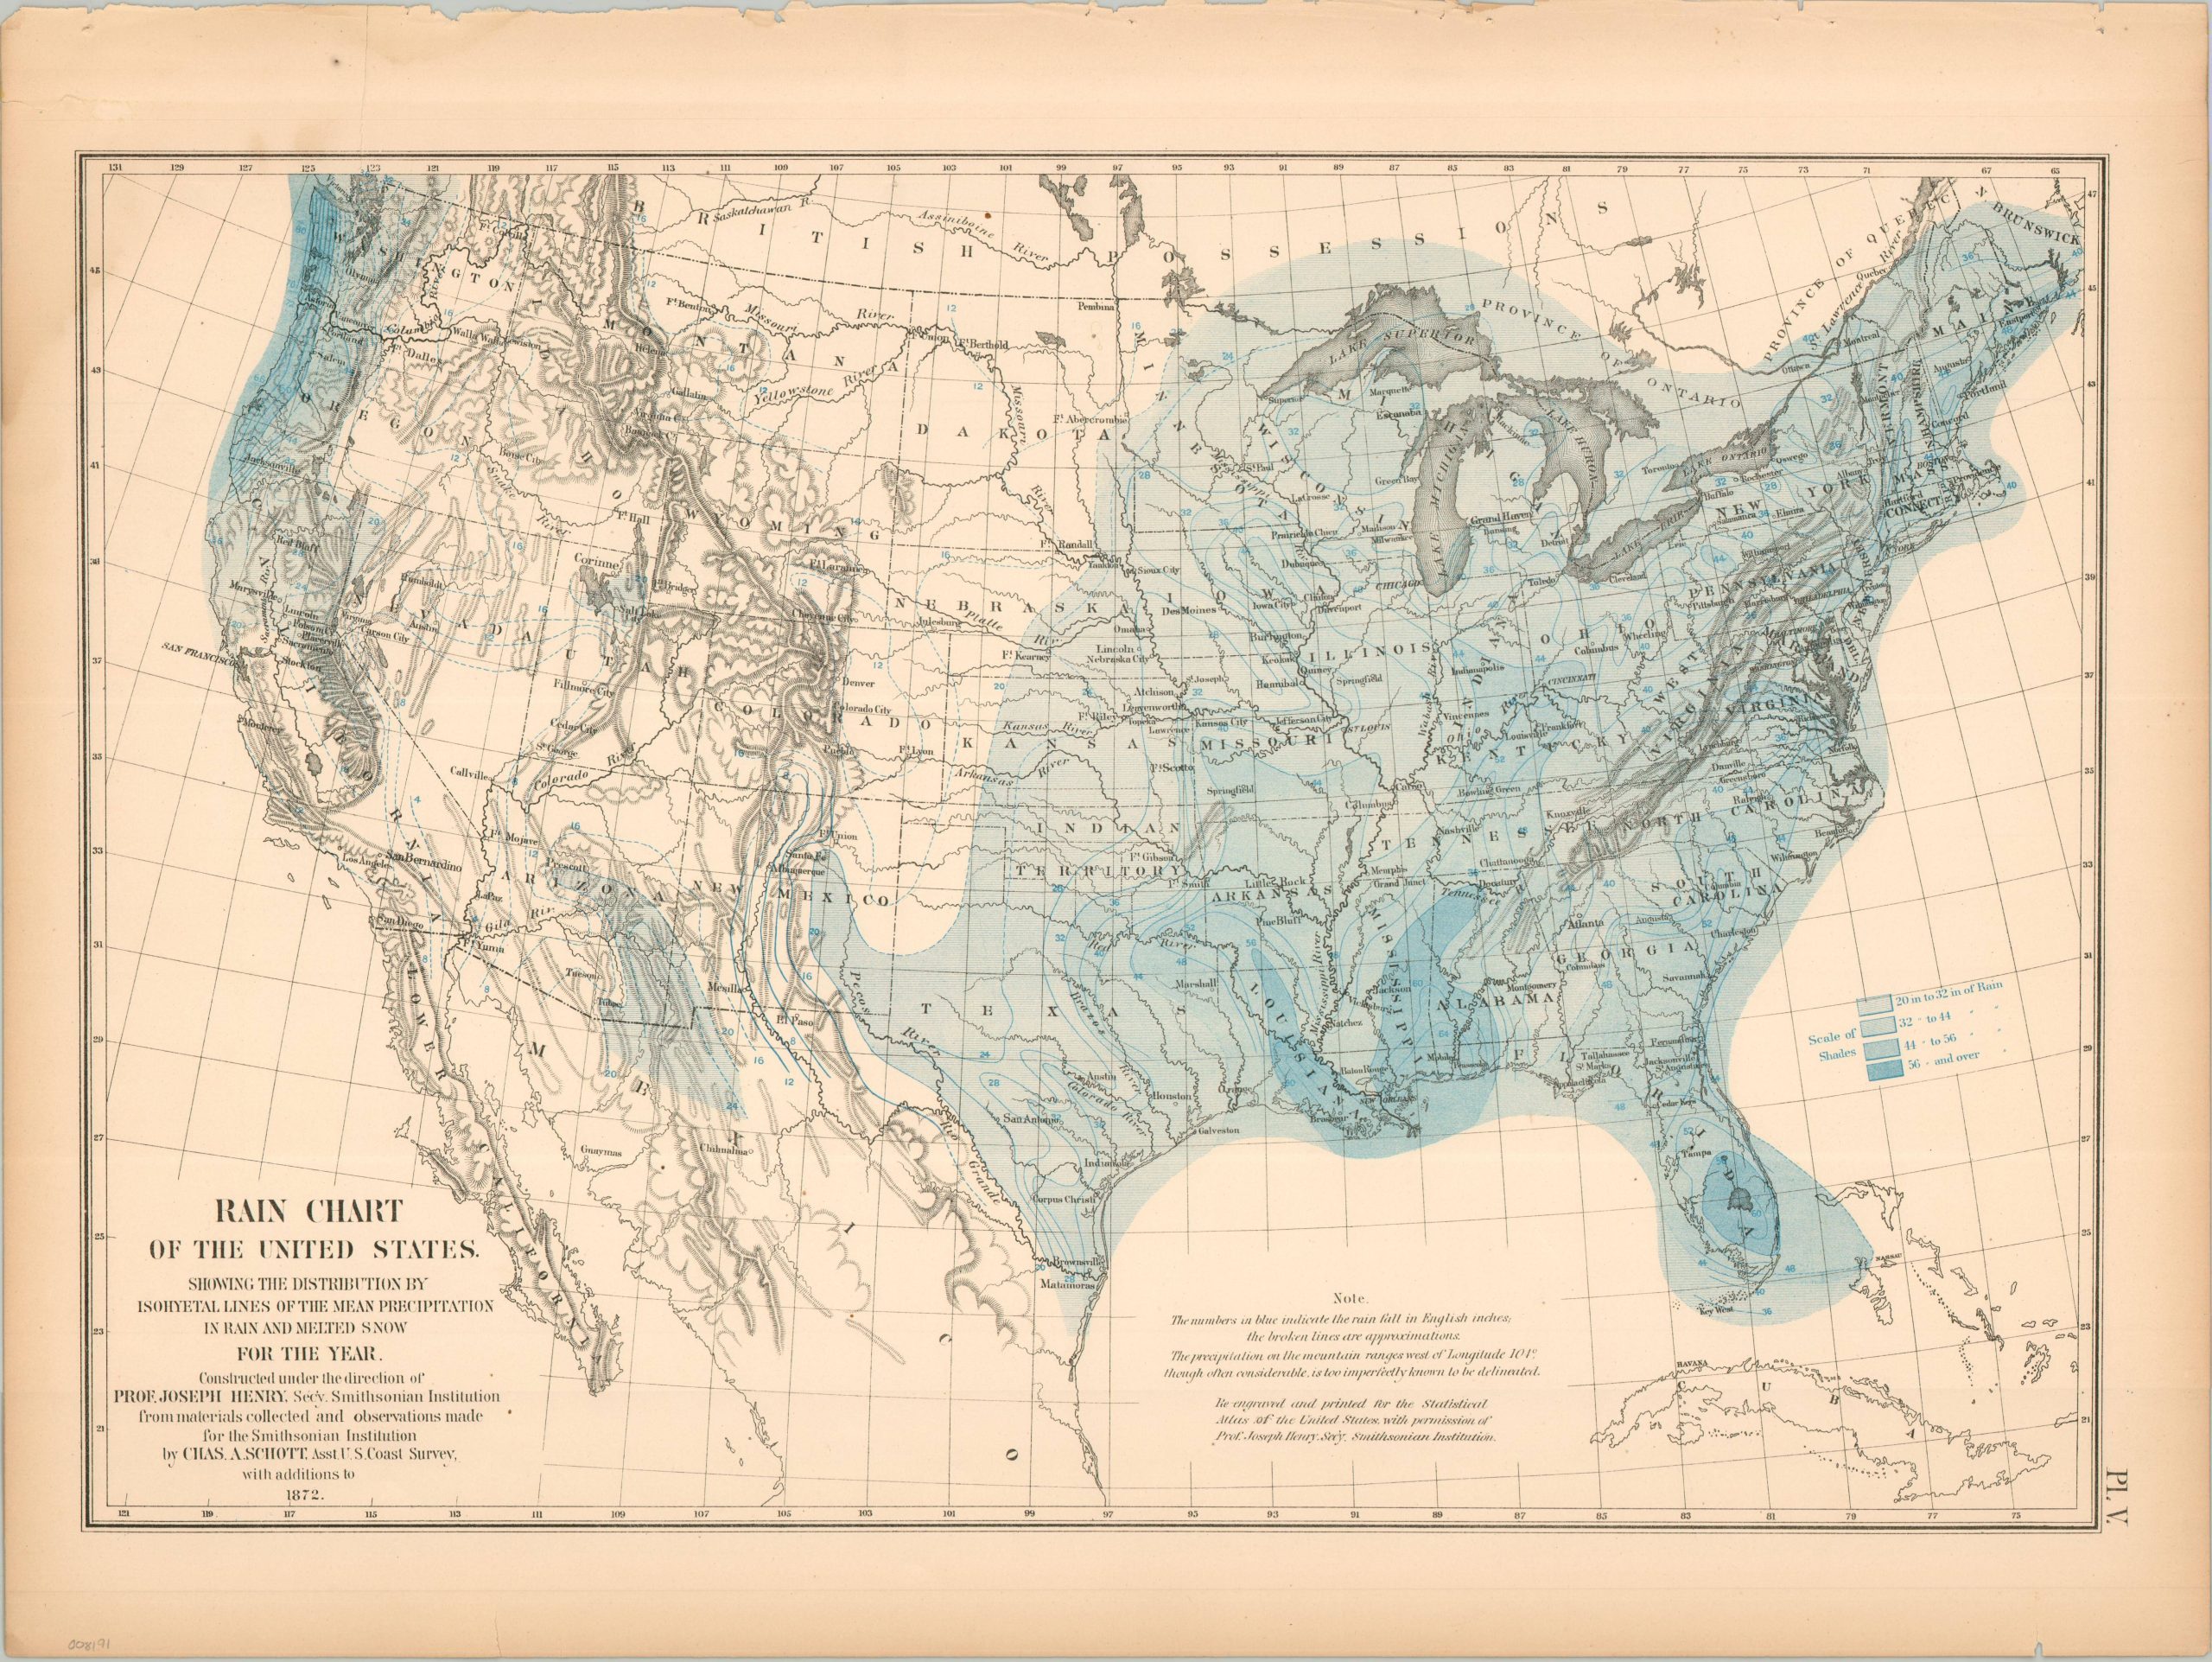
This interesting map of the United States ‘shows the distribution by isohyetal lines of the mean precipitation in Rain and Melted Snow’ for the year 1872, according to its subtitle. Shades of blue show the approximate ranges, while overlaid numbers offer specifics, where available. The wettest area, by far, is the Pacific Northwest, with certain areas on the Olympic Peninsula recording 80 inches for the year. Compiled by Charles Schott of the U.S. Coast Survey under the direction of Joseph Henry of the Smithsonian Institute (who permitted reprinting). The map was originally issued as part of The Statistical Atlas of the United States Based on the Results of the Ninth Census, 1870, compiled by Census Superintendent Francis A. Walker. Lithographed by Julius Bien and published in 1874. The atlas serves as the ultimate 19th-century “data portrait” of a reunified nation, meticulously synthesizing geography, climate, and demographics into a visual manifesto of America’s industrial and economic potential.