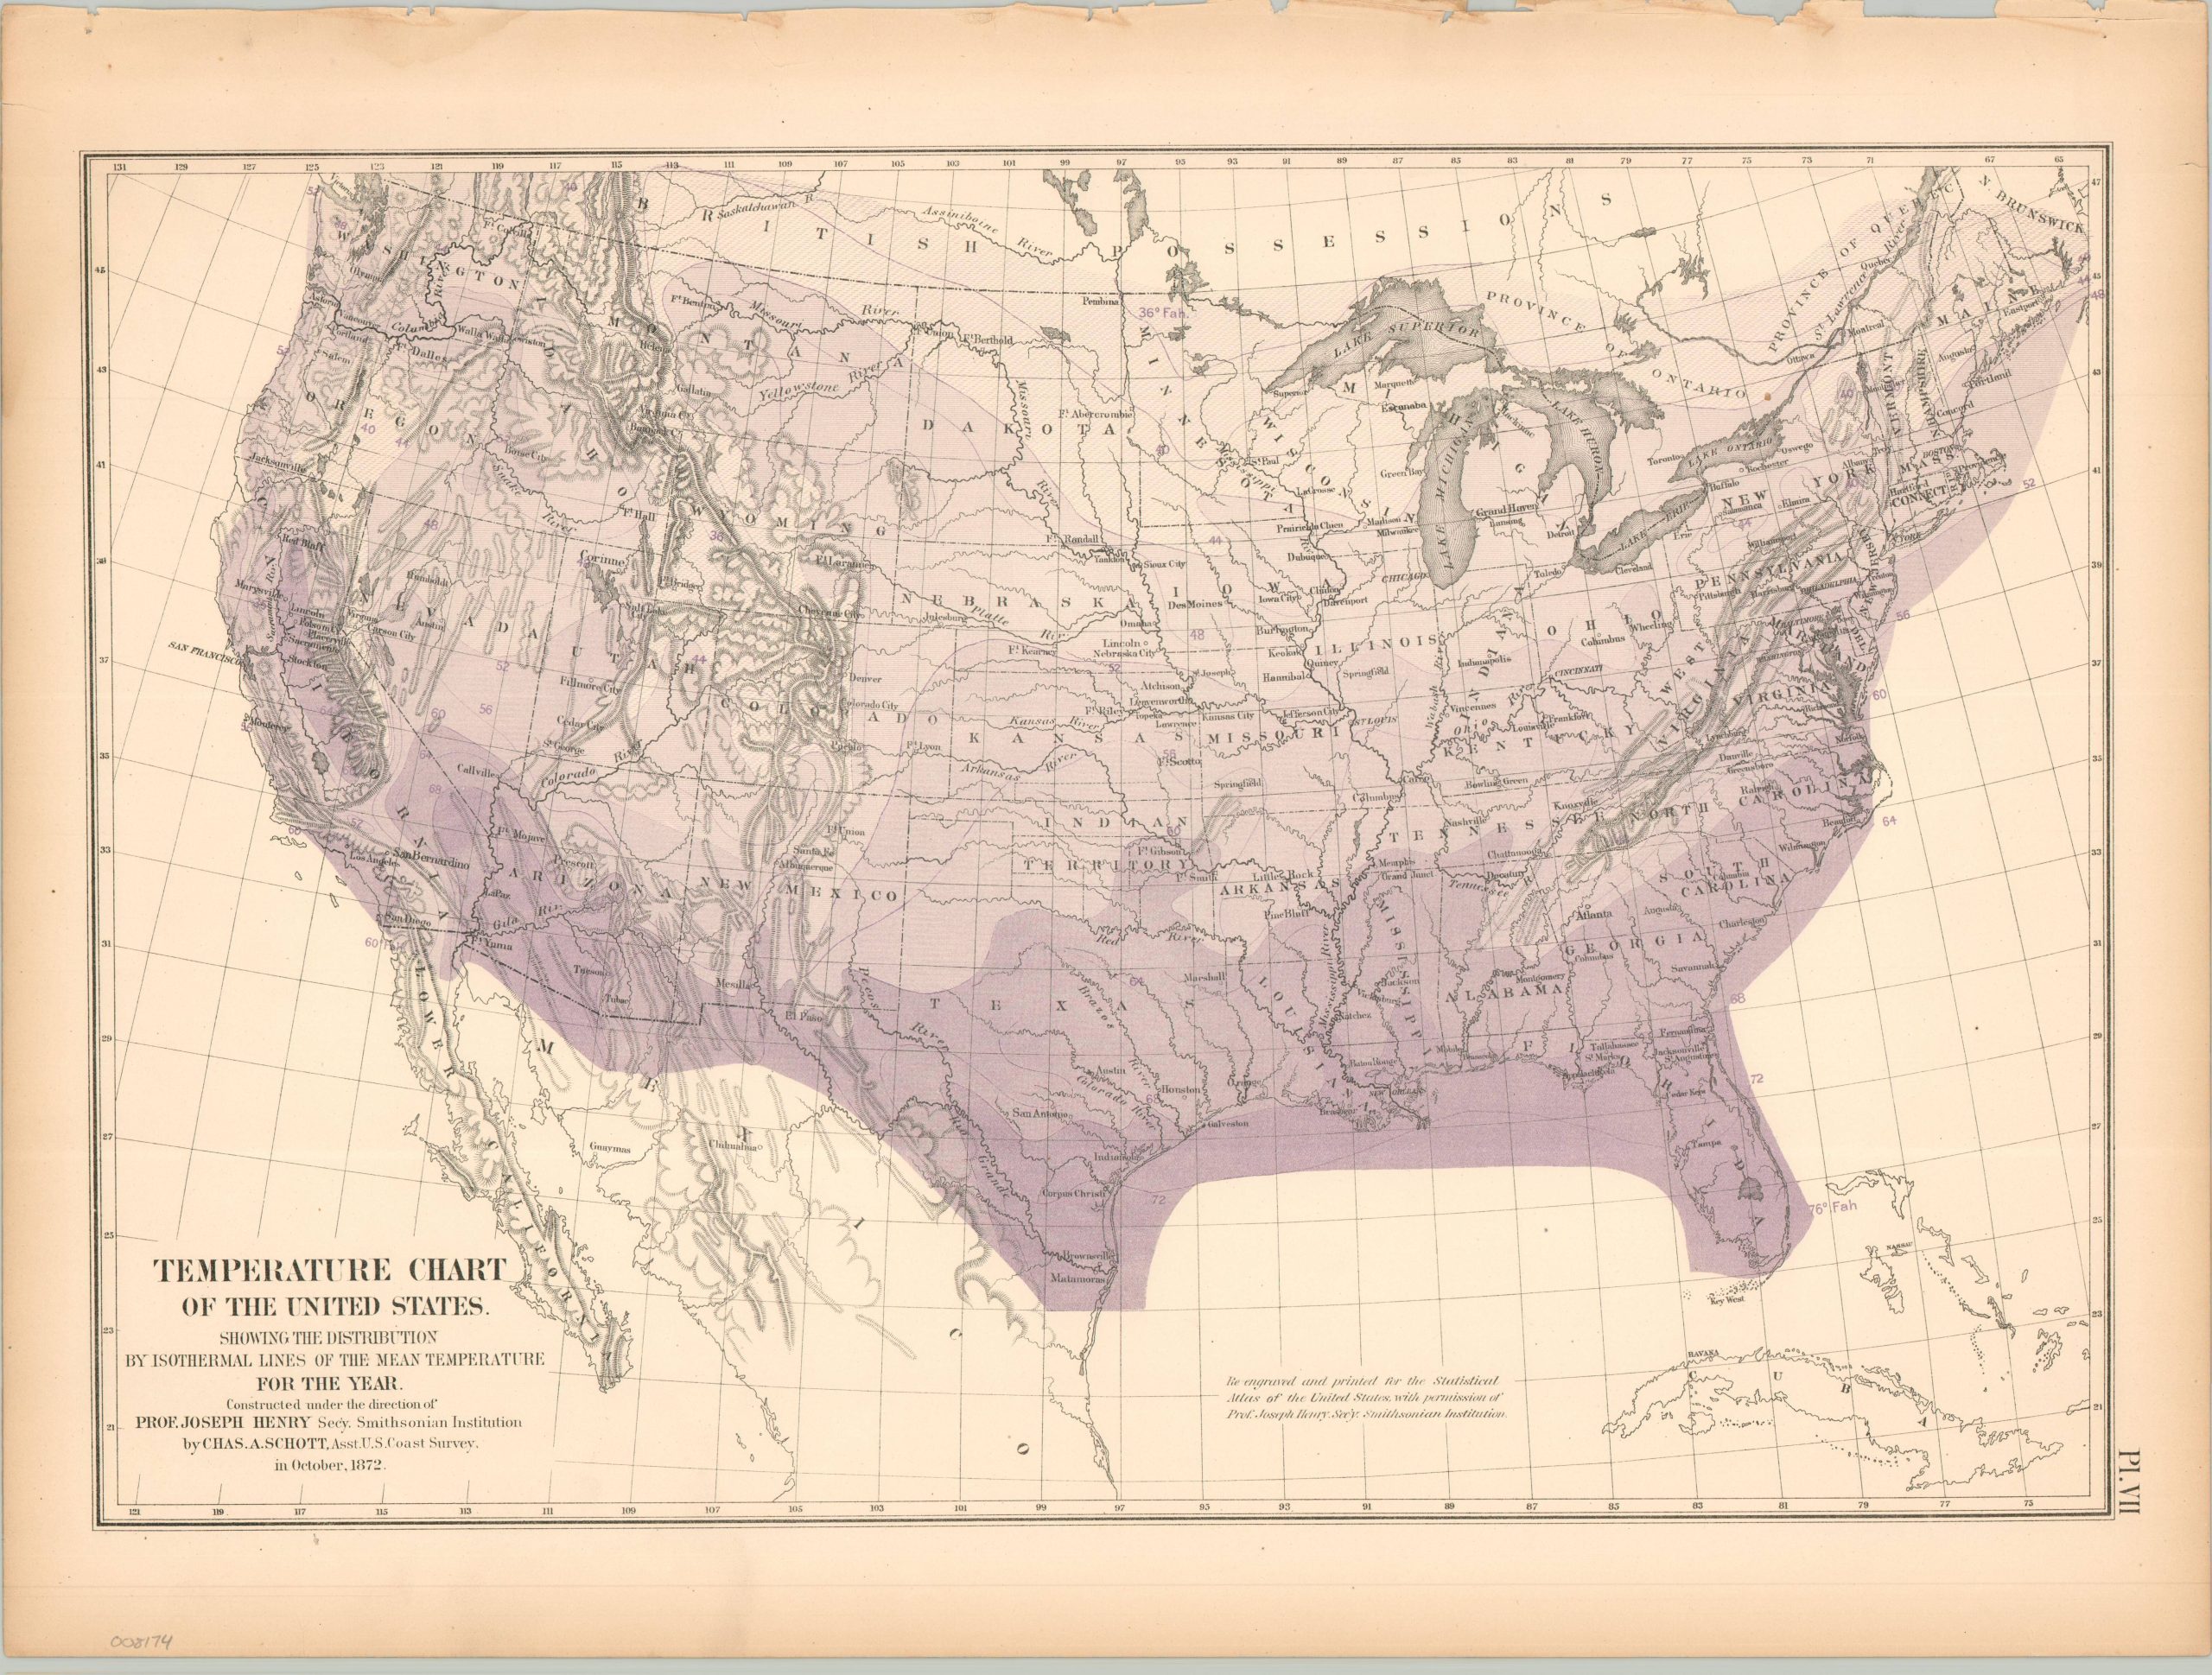
This intriguing analytical map of the United States was compiled by Charles A. Schott under the direction of the Secretary of the Smithsonian Institution, Joseph Henry. The image uses various shades of purple to highlight the isothermal lines of mean temperature across the country, ranging from 36 degrees in the far north to 72 degrees in the Gulf of Mexico. The map was originally issued as part of The Statistical Atlas of the United States Based on the Results of the Ninth Census, 1870, compiled by Census Superintendent Francis A. Walker. Lithographed by Julius Bien and published in 1874. The atlas serves as the ultimate 19th-century “data portrait” of a reunified nation, meticulously synthesizing geography, climate, and demographics into a visual manifesto of America’s industrial and economic potential.